
Why
TempDB Grows and Doesn’t Reset Easily
TempDB Usage
Causes: TempDB is a global workspace for SQL Server, used for sorting,
hashing, temporary tables, table variables, versioning (snapshot isolation or
read-committed snapshot), and many internal If a query requires more memory
than the server has allocated (for example, a misestimated join or sort), it
will spill to TempDB, writing work
tables to disk. Large temporary tables or result sets can also consume
significant TempDB space. All these factors can cause TempDB to grow rapidly
during heavy queries or long transactions.
Continuous Growth: In this
case, a long-running linked server query likely caused internal work tables (spools, hash join overflow, sort runs) in
TempDB, which kept allocating pages. TempDB will continue to grow until the
operation finishes or TempDB runs out of disk. If nothing intervenes, the
TempDB data files remain at the high-water mark size even after the query
completes (though the space inside may become free).
No Auto-Shrink by Default: TempDB does not automatically shrink on its own. The only time TempDB’s size resets is at SQL Server startup, when it recreates TempDB from the model database. However, it uses the last configured size (which includes any growths that occurred) as the new initial In our scenario, after the first growth event, TempDB’s files were permanently larger. So even after a restart, TempDB started at that large size – it did not revert to the original smaller size. The space can be reclaimed only by explicitly shrinking the TempDB files or by altering the database file sizes.
Why TempDB Didn’t
Shrink on Restart: As explained by Microsoft, when SQL Server
restarts, “tempdb is re-created ... and reset to its last configured size The configured size is the last explicit size
that was set by a file size changing operation (ALTER DATABASE ... MODIFY FILE
or DBCC SHRINKFILE/SHRINKDATABASE)”. In practice, this means any auto-growth or
manual growth persists. In our case, TempDB had grown to accommodate the large
query, so on restart it was created at that same large size. Only after
manually shrinking or altering TempDB would subsequent restarts use a smaller
size.
Space Not Freed
During Operation: During the long query, attempts to shrink
TempDB would likely fail (as the question scenario suggests) because the work
tables or allocations were still active. The error about a “worktable on hold”
indicates TempDB space was tied up by an active operation, blocking shrinking.
Thus, the DBA had to restart SQL Server to break free of the operation and then
shrink TempDB to reclaim space
In summary, TempDB grew large because of an expensive operation and
stayed large because SQL Server preserved that size setting. This is normal
behavior. The key is to identify what
caused the growth (the linked server query, in this case) and address that root
cause rather than relying on restarts or shrinks.
Common Factors causing TempDB Growth

1.
Large Sort Operations
o Queries with ORDER BY clauses on
large result sets
o Group By operations requiring
intermediate sorting
o Join operations on non-indexed
columns requiring sort operations
2.
Hash Operations
o Hash joins on large tables
o Hash aggregates for GROUP BY
without appropriate indexes
o Hash spills to disk when memory
grant is insufficient
3.
Row Versioning
o Transactions using
READ_COMMITTED_SNAPSHOT or SNAPSHOT isolation levels
o Long-running transactions
preventing version cleanup
o Heavy DDL operations under
versioning isolation levels
4.
Table Variables and Temporary Tables
o Extensive use of table variables
or #temp tables
o CTEs that materialize large result
sets
o Nested temporary tables in stored
procedures
5.
Index Operations
o Creating or rebuilding indexes on
large tables
o Statistics updates on large tables
o Online index operations
6.
DBCC Operations
o DBCC CHECKDB and similar
maintenance tasks
o Index defragmentation operations
7.
Parallelism
o Parallel execution plans for
complex queries
o High MAXDOP settings forcing
parallel operations
8.
Query Spills
o Memory grant underestimation
causing operations to spill to TempDB
o Memory pressure forcing in-memory
operations to disk
9.
LOB Data Operations
o Operations on large BLOB/TEXT/XML
columns
o Intermediate storage of large LOB
data
10.
Excessive Workspace Memory Usage
o Window functions on large datasets
o Recursive CTEs with many
iterations
o Complex analytical functions
11.
Linked Server/Distributed Queries
o When
you use a four-part name in a query (e.g. SELECT ... FROM LocalTable JOIN
LinkedServer.RemoteDB.dbo.Table ...), SQL Server’s optimizer may decide to copy
entire remote tables into the local TempDB[1] for processing.
o A
linked server query ended up scanning a large remote table and sending millions
of rows across the network one by one, ultimately copying the entire table.
This kind of behavior would consume enormous TempDB space for intermediate
storage (e.g. sorting or hashing that data).
Step-by-Step Troubleshooting TempDB growth Guide
●
Monitor
TempDB Space: First, confirm that TempDB is indeed the database consuming the
space. You can run sp_spaceused in TempDB or
query the DMV sys.dm_db_file_space_usage to
see space used by TempDB. For example, SELECT
(SUM(user_object_reserved_page_count) +
SUM(internal_object_reserved_page_count))*8/1024 AS Tempdb_MB_Used FROM
sys.dm_db_file_space_usage;. This will show how many MB are in use. If
TempDB is nearly full or unusually large, it’s a red flag.
●
Check for
Recent Growth Events: Look at the SQL Server log (or Extended
Events if configured) for any messages about TempDB file auto-growth. An
auto-growth event will indicate when and how much TempDB expanded. This can
correlate with the timing of a query. Also check Windows event logs or alerts
if any were triggered for low disk space on the TempDB drive.
●
Identify
Sessions Using TempDB Heavily:Use dynamic management views to find which session is consuming TempDB space.
Two useful DMVs are sys.dm_db_session_space_usage
and sys.dm_db_task_space_usage. These can
tell you how many pages each session has allocated in TempDB (both user and
internal objects). For example, a query like:
SELECT
s.session_id,
r.status,
(t.internal_objects_alloc_page_count
+ t.user_objects_alloc_page_count)
AS pages_used,
DB_NAME(r.database_id)
AS database_context,
r.command,
r.sql_text
FROM sys.dm_db_task_space_usage
AS t
JOIN sys.dm_exec_requests
AS r
ON
t.session_id =
r.session_id AND
t.request_id =
r.request_id
CROSS APPLY sys.dm_exec_sql_text(r.sql_handle) AS sql_text
JOIN sys.dm_exec_sessions
AS s ON t.session_id
= s.session_id
WHERE (t.internal_objects_alloc_page_count
+ t.user_objects_alloc_page_count)
> 0
ORDER BY pages_used DESC;
●
Alternatively, you can use community tools
like sp_WhoIsActive (by Adam
Machanic) which, when run with appropriate parameters, will list TempDB usage
per session. For example, EXEC sp_WhoIsActive
@get_tempdb_info=1; will include TempDB allocation for each active
query.
Take Emergency
Action (If Needed):
If the system is at risk of
crashing due to no space (TempDB or log completely full), you need to free
resources by Killing the Offending
Session
After the session is gone, TempDB will
still be at its grown size (files won’t shrink automatically),you can attempt a
manual shrink of TempDB:
USE tempdb;
DBCC SHRINKFILE('tempdev',
<desired_size_mb>);
Keep in mind shrinking TempDB is
typically a last resort and may cause fragmentation; it’s usually better to
leave it if you have the disk space, and adjust the initial size for next
startup.
TempDB
Configuration Best Practices
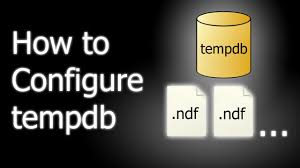
Proper TempDB configuration can alleviate some issues and prevent
TempDB from becoming a bottleneck or single point of contention:
●
Multiple
Data Files: It’s a best practice to use multiple TempDB data files to reduce
allocation contention on system pages (PFS, GAM, SGAM). The latest Microsoft
guidance suggests one TempDB data file
per logical CPU, up to 8 files For example, if your server has 16 cores,
start with 8 TempDB files; if it has 4 cores, use 4 files. Having 8 equally
sized files often suffices for most workloads . Only add more than 8 if you
still observe contention (manifested by PAGELATCH_UP/EX waits on TempDB pages)
●
Preallocate
Adequate Size: Configure the initial size of TempDB data files to accommodate
typical usage peaks. This avoids frequent auto-growths, which can be expensive.
For example, if TempDB tends to use up to 20 GB during heavy operations, set
the total initial size of files to 20 GB (spread across files, e.g., 8 files of
2.5 GB each) to start with. This way, SQL Server doesn’t have to pause to grow
the files during a heavy query.
●
Autogrowth
Settings: Set TempDB files to auto-grow in reasonable chunks (not too small,
not too large). Avoid percentage growth settings, as they become inefficient
(10% of a 20 GB file is 2 GB, which might be fine, but 10% of a 100 GB file is
10 GB which might be too large a jump and take long to allocate). A fixed
growth size of a few hundred MB to a couple GB is typically recommended.
●
Uniform
Size and Growth: Ensure all TempDB data files are the same size and have the same
growth settings. SQL Server uses a proportional fill algorithm for TempDB
files, and if one file is smaller, it can become a hotspot. Monitor after any
auto-growth that all files remain equal – if one file grew, manually grow the
others to match if needed.
●
TempDB on
Fast Storage: Place TempDB on one of the fastest storage volumes available,
separate from critical user databases. TempDB is highly I/O intensive for many
workloads, so using SSD/NVMe storage for it can significantly improve
performance. This doesn’t prevent growth issues per se, but it makes TempDB
operations faster and more resilient.
●
TempDB
Logging: TempDB has its own log file. Usually one log file is enough (don’t
create multiple log files – that doesn’t improve throughput). But do set the
TempDB log’s initial size and autogrowth appropriately as well. As noted in one
best practice guide, configure TempDB’s
log with a large initial size so that on restart it doesn’t start tiny and
then have to grow.
●
Regular
Maintenance: You generally should not need to shrink TempDB on a schedule.
Instead, set it up correctly and let it be. If you encounter an unexpected
growth (as in this scenario), afterwards you might shrink it back to normal
size during a maintenance window. But avoid setting TempDB to auto-shrink or
frequently shrinking it, as that can interfere with performance and will likely
just grow again.
Monitoring and Alerting for TempDB Growth
●
SQL Server
Agent Alerts: Leverage SQL Server’s built-in alerting mechanism. You can configure
an alert on specific error numbers:
○
Alert on Error
1105 (TempDB filegroup full)
sp_add_alert
@name='TempDB Full', @message_id=1105, @severity=17,
@delay_between_responses=0, @notification_message='TempDB full - investigate
session using TempDB'
○
You can also set up a performance condition alert. For example, an alert when TempDB data
file usage > 80% for over 5 minutes. There is a performance counter Free Space in Tempdb (KB) or you can use a custom
condition via a job
●
Continuous
Monitoring of TempDB usage: Consider implementing a job that regularly
checks TempDB usage and logs the top consumers.
●
OS Level
Monitoring: Don’t forget to monitor disk space at the OS level. Ensure your
infrastructure monitoring checks the drive where TempDB resides and the drive
for log files. If free space drops below a threshold (say 15%), alerts should
go out. In our scenario, an alert on the disk filling up might have been a
final warning before things went completely south.


